

25 Jan 2016: Mulling a posting in Linkedin by Jeffrey Tian, on bean stocks in 25 year commodity cycle
source: https://www.linkedin.com/pulse/does-anybody-do-super-long-term-commodity-cycle-analysis-jeffrey-tian?trk=hp-feed-article-title-publish
Editor's comments:
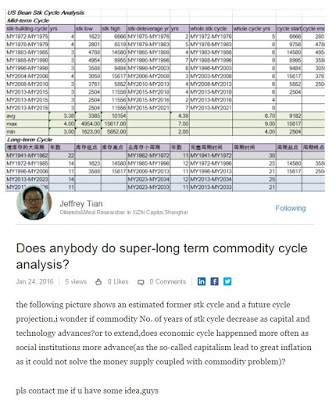
- Thanks for sharing. It is great to see on a stock basis the long term c. 25 year cycle for commodity.
- I like to look and wonder (but never really taken time to analyse) current price against long term trend price trends. These have been mean reverting! But this is a rather historical perspective as you remain an observer of how long it takes to revert to trend. Maybe interesting to chart short vs long term price with standard deviation overlay (for equities, I think +/1 2 SDs was usually pretty interesting).
- In previous career, I spent time on equity market price indicators and looked at relative price of companies in different parts of the value chain (but price history often not long enough): commodity trading, production, consumer goods (e.g. Unilever, Mcdonald's - which is still really high) and the billionaire owners buying of property and paintings.
- On long cycle issues, a) the terms of trade trend against commodities was one of the things learned in development economics course - did biofuels and bankers/traders impact this indicator a lot? And/or can we see any positives from agro-tech from Monsanto etc? b) Now, it seems we have to cope with capacity build up in oil & gas + renewables thanks to low interest rates. c) At same time, what is future impact of "4th industrial revolution" going forward or is agro still the same?
4 July 2014: In researching commodity economics, the long cycles are often of interest.
Editor's note: I was talking to a senior commodity economist last night on how far prices have reached above the mean; notably palm oil, well supported by crude oil prices (with the significant usage of palm biodiesel; it would be good to look at how many SDs above mean commodity prices are running right now). He also thought that the often cited USD70/barrel cost of production might be overstated (only some offshore new fields face such costs; and they would keep pumping if cashflow positive, no?). Just prior to the late 2000s run up, reports from onshore Canada and USA on shale gas (and fracking?) indicated costs in the mid-USD20s.What will happen when interest rates get off the floor? Here's macrotrends.net's LIBOR rates since the mid-1980s: http://www.macrotrends.net/1433/historical-libor-rates-chart
Here's a chart of oil prices from 1869-2011 (2010 prices) from wtrg.com:

100 year on gold and silver (Jan 2012 base): http://www.macrotrends.net/1333/gold-and-silver-prices-100-year-historical-chart
30 year charts here:
soybean oil: http://www.indexmundi.com/commodities/?commodity=soybean-oil&months=360
palm oil: http://www.indexmundi.com/commodities/?commodity=palm-oil&months=360
sugar: http://www.indexmundi.com/commodities/?commodity=sugar&months=360
rubber: http://www.indexmundi.com/commodities/?commodity=rubber&months=360
................
Talking about cycles, on the wealth-gap cycle, it appears we are back to the 1920s, a period of very buoyant market and commodity prices... The Richest Rich Are in a Class by Themselves By Peter Coy April 03, 2014; http://www.businessweek.com/articles/2014-04-03/top-tenth-of-1-percenters-reaps-all-the-riches#r=rss; The richest 0.1 percent of the American population has rebuilt its share of wealth back to where it was in the Roaring Twenties. And the richest 0.01 percent’s share has grown even more rapidly, quadrupling since the eve of the Reagan Revolution.... These figures come out of a clever analysis by economists Emmanuel Saez of the University of California at Berkeley and Gabriel Zucman of the London School of Economics, who is a visiting professor at Berkeley. The Internal Revenue Service asks about income, not wealth, which is the market value of real estate, stocks, bonds, and other assets. Saez and Zucman were able to deduce wealth by exploiting IRS data going back to when the federal income tax was instituted in 1913. They figured out how much property different strata of society owned by looking at the income that was generated by that property, such as dividends and capital gains.....